


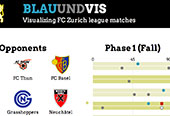
BlauUndVis
A few soccer visualizations have been done that took a general look at soccer games. A more recent one is Michael Deal’s visualization of the 32 world cup group stage matches for the sports brand Umbro. My idea was to visualize a whole season from the point of view of one specific team. I planned to focus on a few things interesting to me:
- rivalries with other teams
- differences between the results at home and away
- results of specific players (goals scored, yellow/red cards, field time)
The data that I got for this type of visualization has a rich collection of information. However, regular match statistics don’t reveal any longitudinal effects and are hard to read. The ultimate goal was to reveal patterns in the game statistics by letting the user interact with the brushing and linking functionality of the visualization.
The visualization shows the season 2003/2004 from the point of view of FC Zurich. The left hand panel allows to filter the 36 games on the right side with the goal of revealing interesting patterns. For example, selecting one player shows his field time and his performance in terms of goals shot and cards received.