
Census Visualization 2010
This project was part of my research work with the Redistricting Group at the Berkeley Law Center for Research. The group is widely recognized for their expertise in the redistricting process that happens every ten years as a direct result of the decennial census.
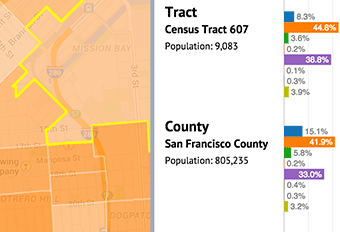
As part of my research, I developed a prototype that allowed users to explore the racial breakdown from a county level down to the individual block. Because districts are being drawn across blocks, the tool allowed to combine multiple blocks, thus revealing how the numbers change depending where the lines are drawn.